The system that we use internally to build the code behind our browser extension was put together over half a decade ago. While we were able to iteratively grow it over time to meet our needs, it became slower and slower in the process. Let’s give it a much-needed upgrade!
I joined 1Password as an intern back in early 2020. That’s a date with … some interesting memories! One of them is my recollection of how long it took to build our browser extension. At that time my 13 inch-MacBook Pro with an Intel i5 processor and 8GB RAM needed roughly 30 seconds to do a warm build of our extension (a warm build means I’ve already built the extension at least once, and I’m rebuilding it to test some changes I’ve made.) Thirty seconds wasn’t bad by any means but it was long enough to be annoying and I often wished it could be faster.
Fast forward to 2024. We have many more folks working on the extension, I’m now a senior developer with a much more capable M1-equipped laptop, and our extension is a wee bit larger than it used to be. I’ve had a hand in building lots of cool features over the last four years, and many of them required our build system to stretch in new and interesting ways. That stretching increased warm extension build times to an unfortunate one minute and ten seconds on my M1 Max-powered MacBook Pro. Throwing more compute power at the problem clearly isn’t going to help!
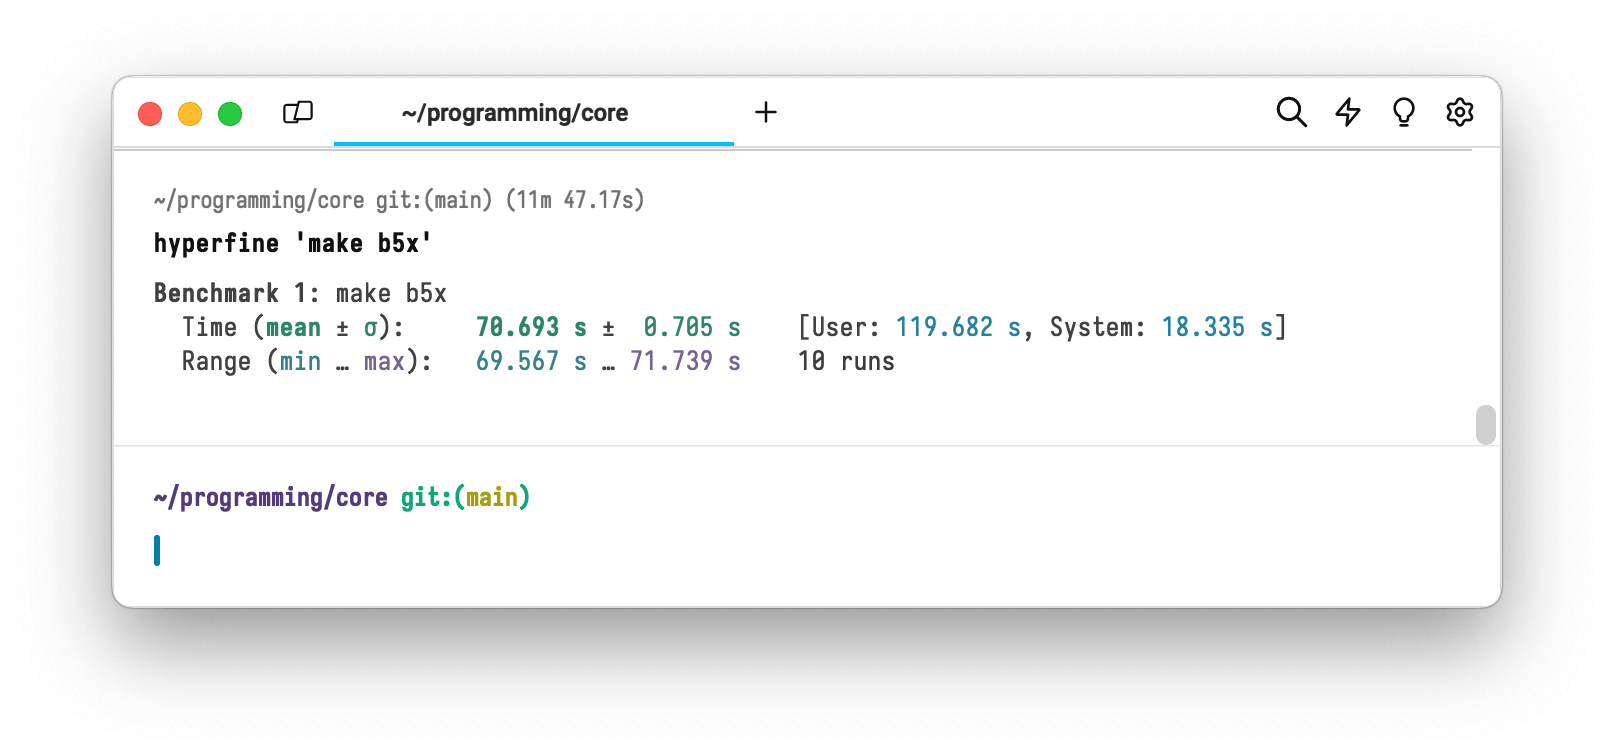
One minute and ten seconds is an eternity when you consider that any source code change must funnel its way through this system to be tested by a developer! Long build times slow down everyone’s work, extend the time it takes to onboard new developers, and create an environment where it’s difficult to enter flow state during day-to-day tasks.
I believed we could do better than the status quo and I wanted to prove it.
It’s hackathon time!
Fortunately, I didn’t have to wait long for an opportunity to arise. We had a company-wide Beyond Boundaries hackathon scheduled for early February. I spent time in January collecting data, writing up a hackathon project proposal, recruiting team members, and doing some preliminary research to shore up my understanding of our existing build system and figure out how we were going to profile it.
The existing system consisted of many individual commands and tools glued together by make. We were going to need a way to get a high-level profile of the entire system to be able to identify areas for improvement and ensure we were making positive progress during the hackathon time. I tried out a few different approaches and ended up landing on something that worked out quite well, which I’ll share here.
Make allows for defining the shell that should be used to execute commands. It turns out that we can specify any script as the shell:
make SHELL=path/to/script.sh
That allows us to build a small script that executes a given command, but does so within a wrapper that we control:
#!/bin/zsh
echo "before running the command"
eval "$2"
echo "after running the command"
We can use otel-cli in this script to report an OpenTelemetry span for the command that we ran, including information like the start and end time, working directory, and the command string itself:
#!/bin/zsh
export OTEL_EXPORTER_OTLP_ENDPOINT=localhost:4317

start=$(date +%s.%N) # Unix epoch with nanoseconds
eval "$2"
end=$(date +%s.%N) # Unix epoch with nanoseconds

duration=$(( $(echo "$end - $start" | bc) ))
if (( duration > 0.1 )); then
    # report spans above 100ms (cuts down on noise)
    otel-cli span -n "$2" -s "b5x" --attrs pwd="$(pwd)" --start $start --end $end
fi
All we need now is a server to collect and render the reported spans. We can use Jaeger for this purpose. Here’s what a profile of our build system looked like:
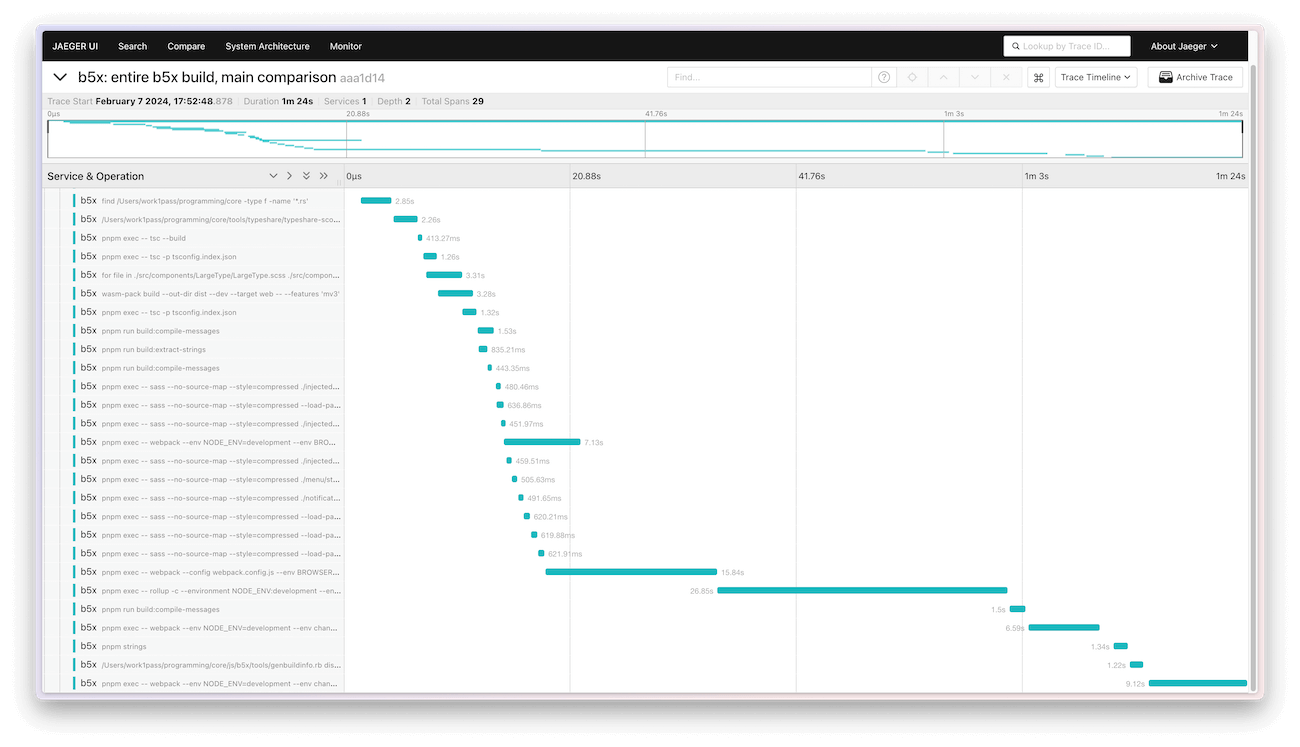
This started us off with some great high-level insights:
- Long Webpack / Rollup runs made up the majority of the build time.
- Many smaller dependencies were built one-by-one, with great opportunities for parallelism.
- Some hot-ticket items at the very beginning were longer than they needed to be, holding up the rest of the build process.
- In particular, we were relying on a
findcommand to avoid rerunning typeshare when Rust files hadn’t changed. This worked great … except running thatfindcommand across our repo took much longer than simply rerunningtypeshareevery time!
Some of those problems are easy to correct. For example, we can run multiple shell commands in parallel, or otherwise remove or shift dependencies to reduce times. Making Webpack or Rollup faster is more involved, though. We had thousands of lines of Webpack and Rollup configuration across multiple files, with many different plugins. How could we shorten these times?
I began our hackathon project with an open slate; everyone on the team was encouraged to pursue any idea they had for reducing our bundler runtime. That could mean making improvements to our existing configurations, using different plugins, or even replacing the bundlers entirely with something new. This open-ended approach was key to quickly finding promising paths forward, and with multiple developers on the team it made sense to divide and conquer.
A couple of interesting discoveries arose from this:
- Using esbuild as a loader for Webpack / loader for Rollup resulted in some large performance wins.
- For Rollup specifically it cut runtime by about 80%. Not bad!
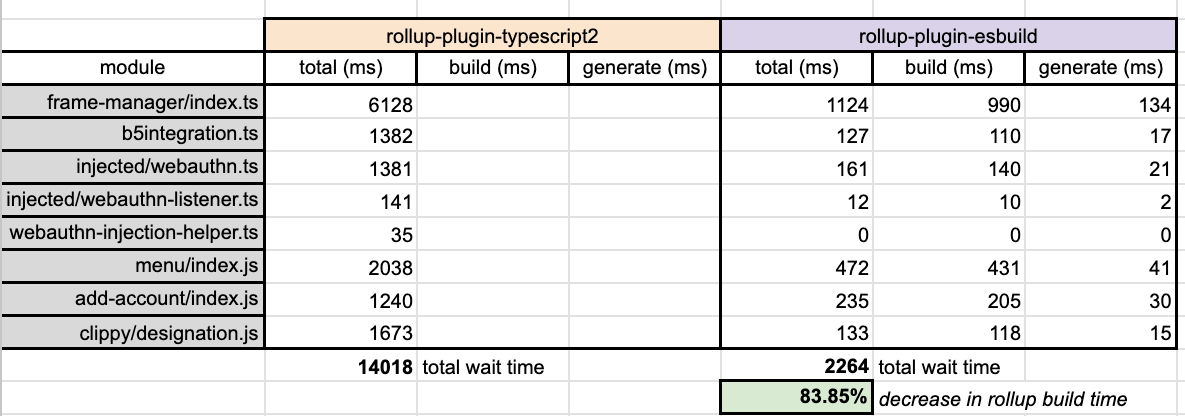
- Using esbuild directly as a complete replacement for Webpack / Rollup was extremely promising, reducing bundle times by ~90%.
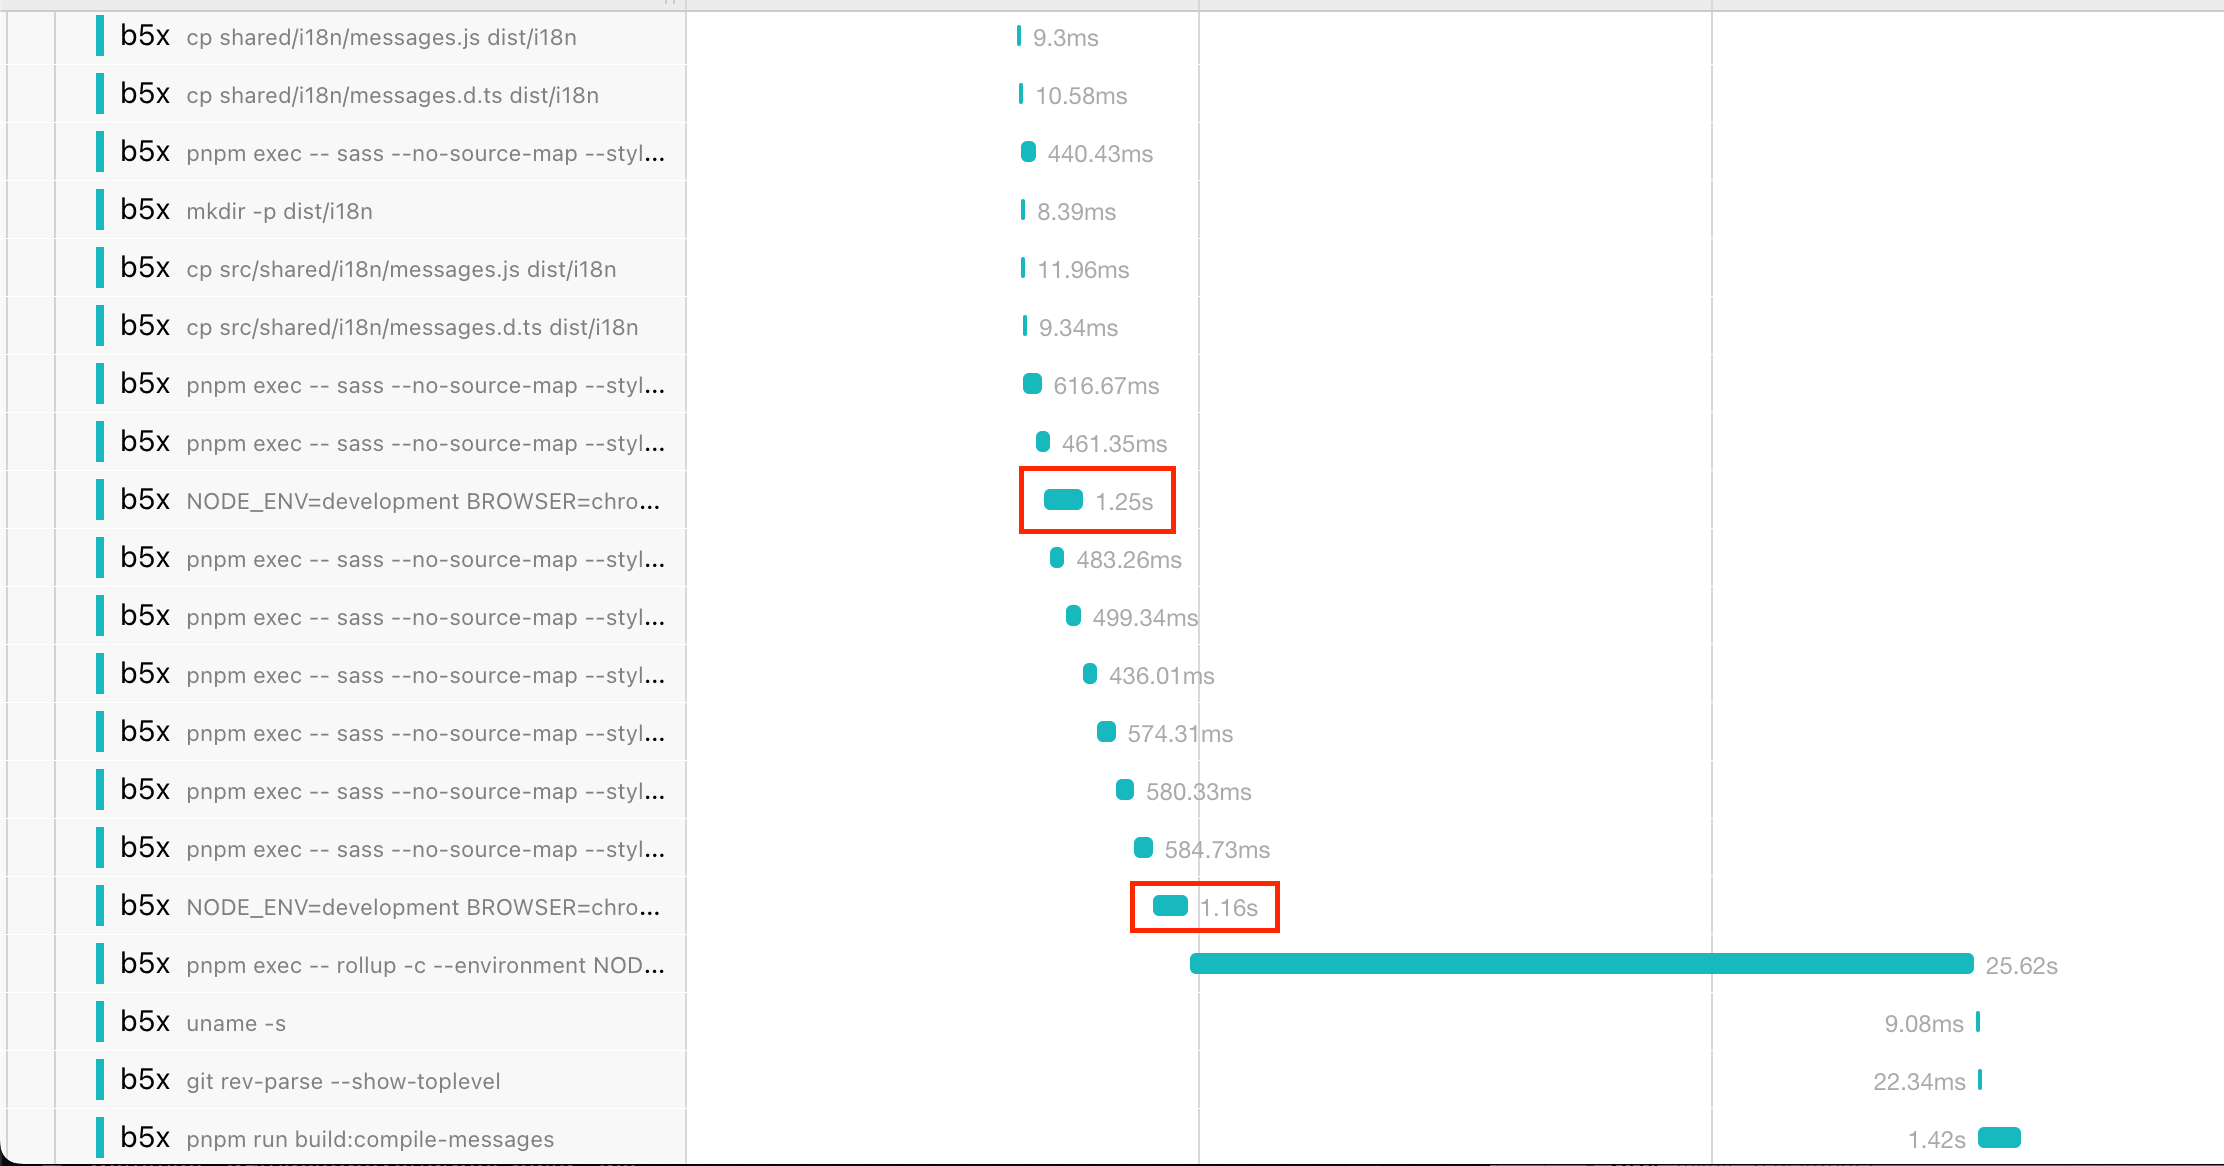
- Here’s the time it took a couple of our Webpack configurations to run:
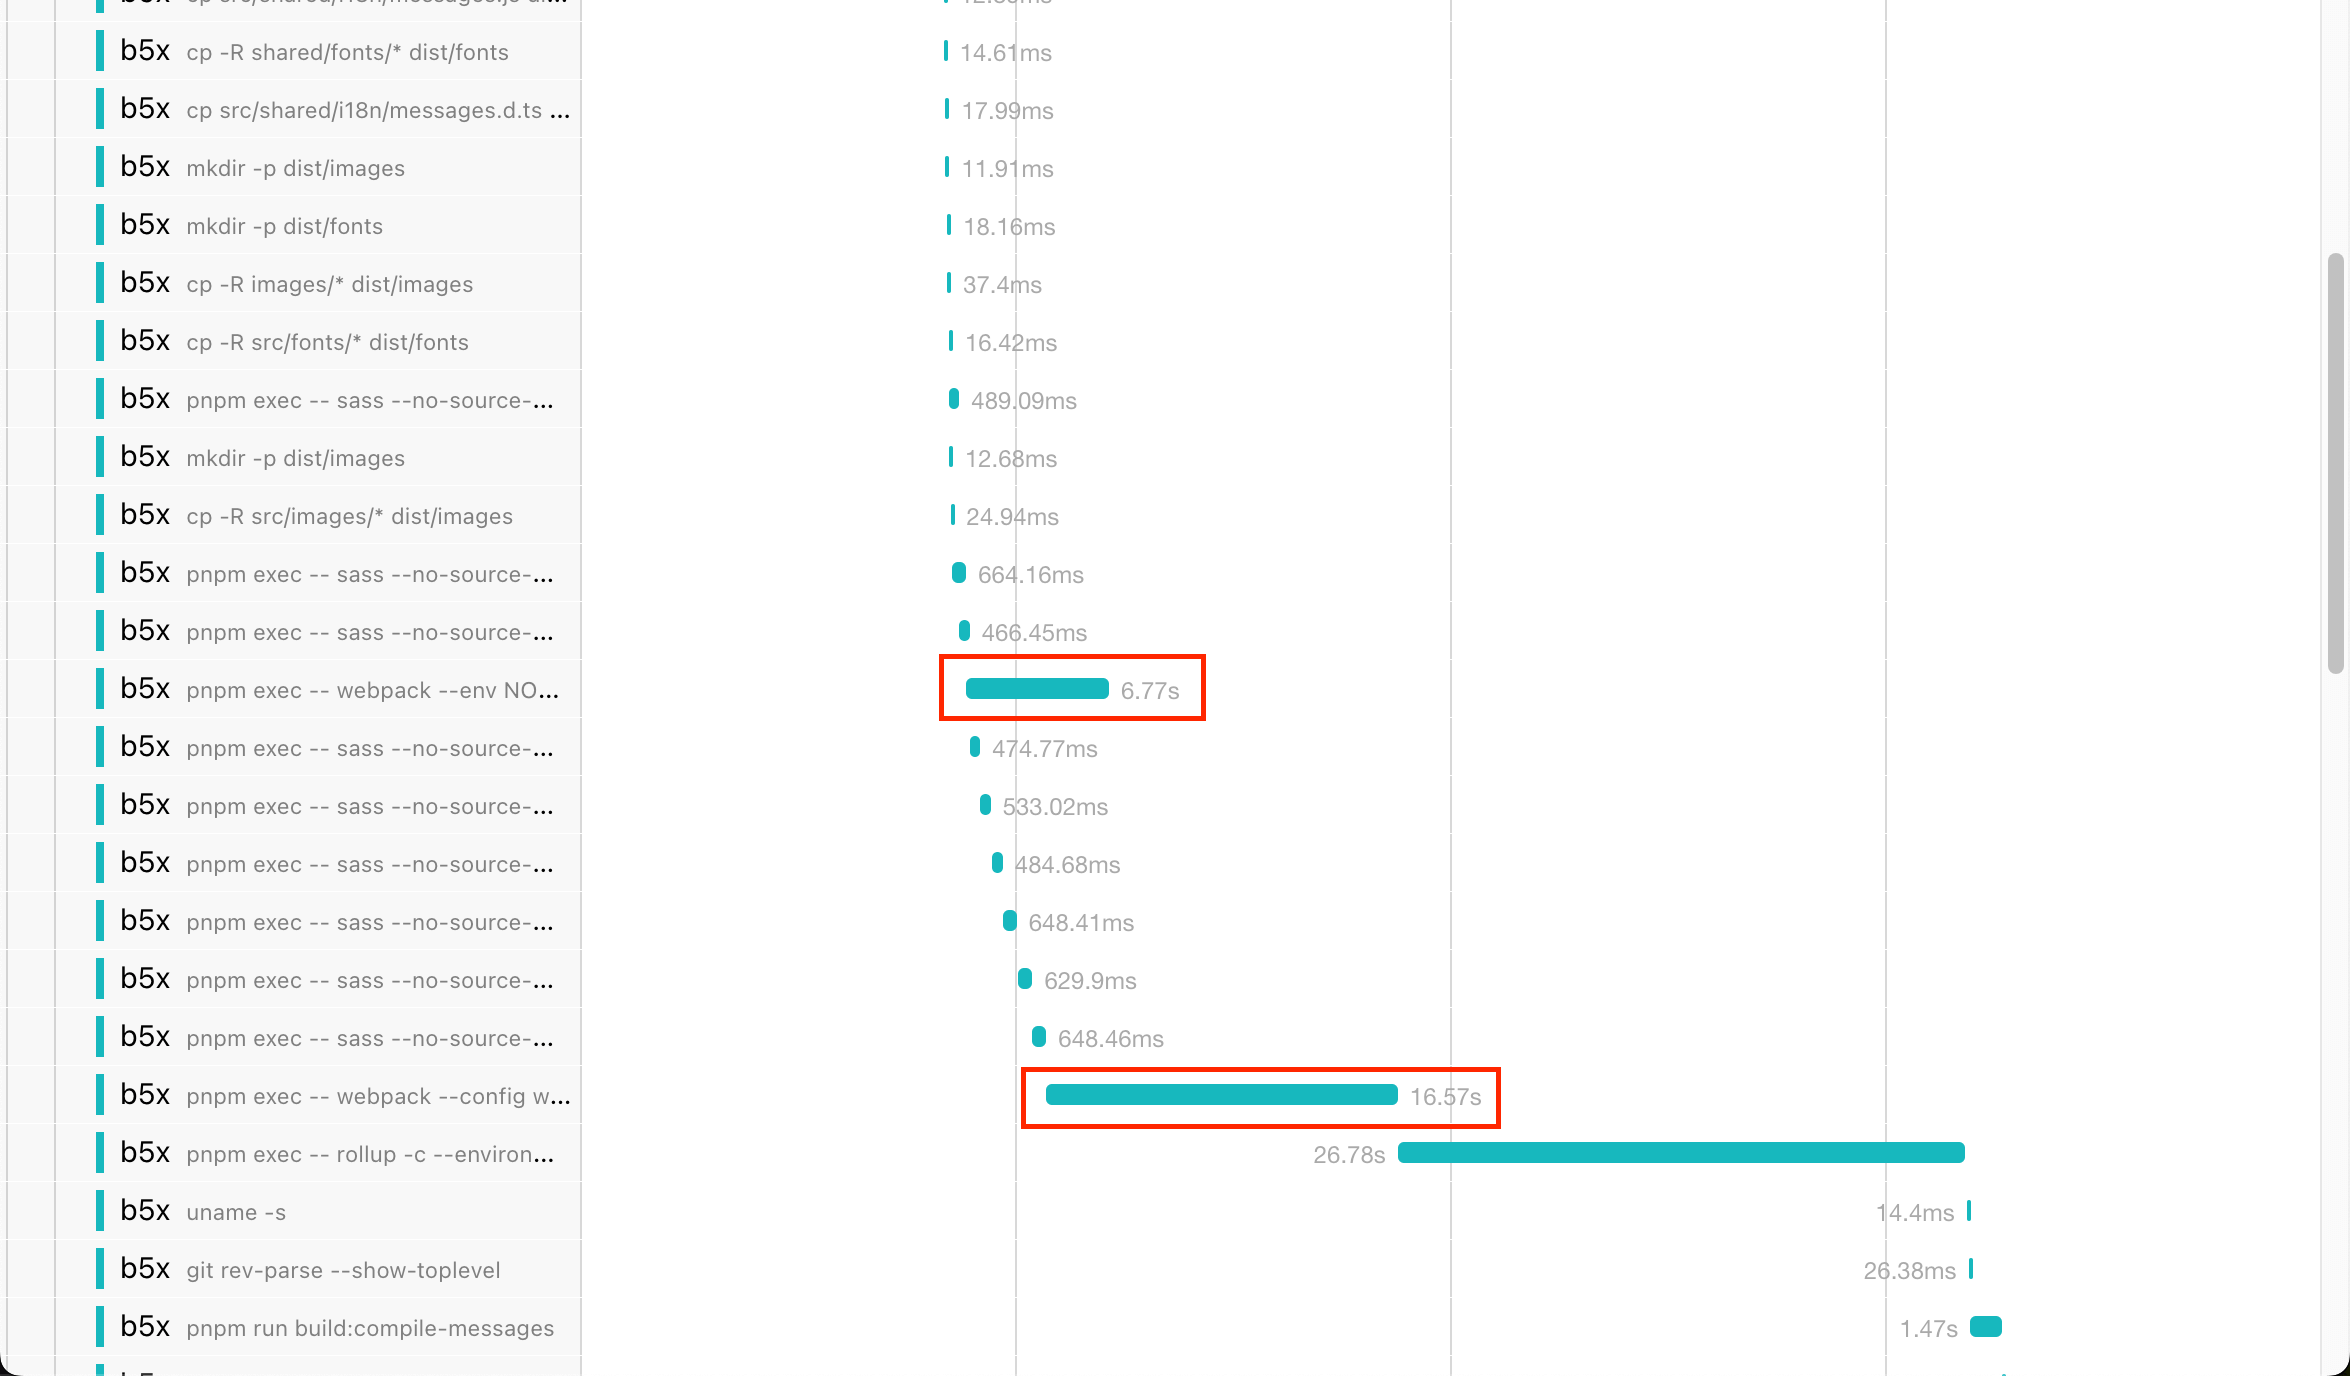
- And here’s the time it took esbuild ports of those same Webpack configurations:
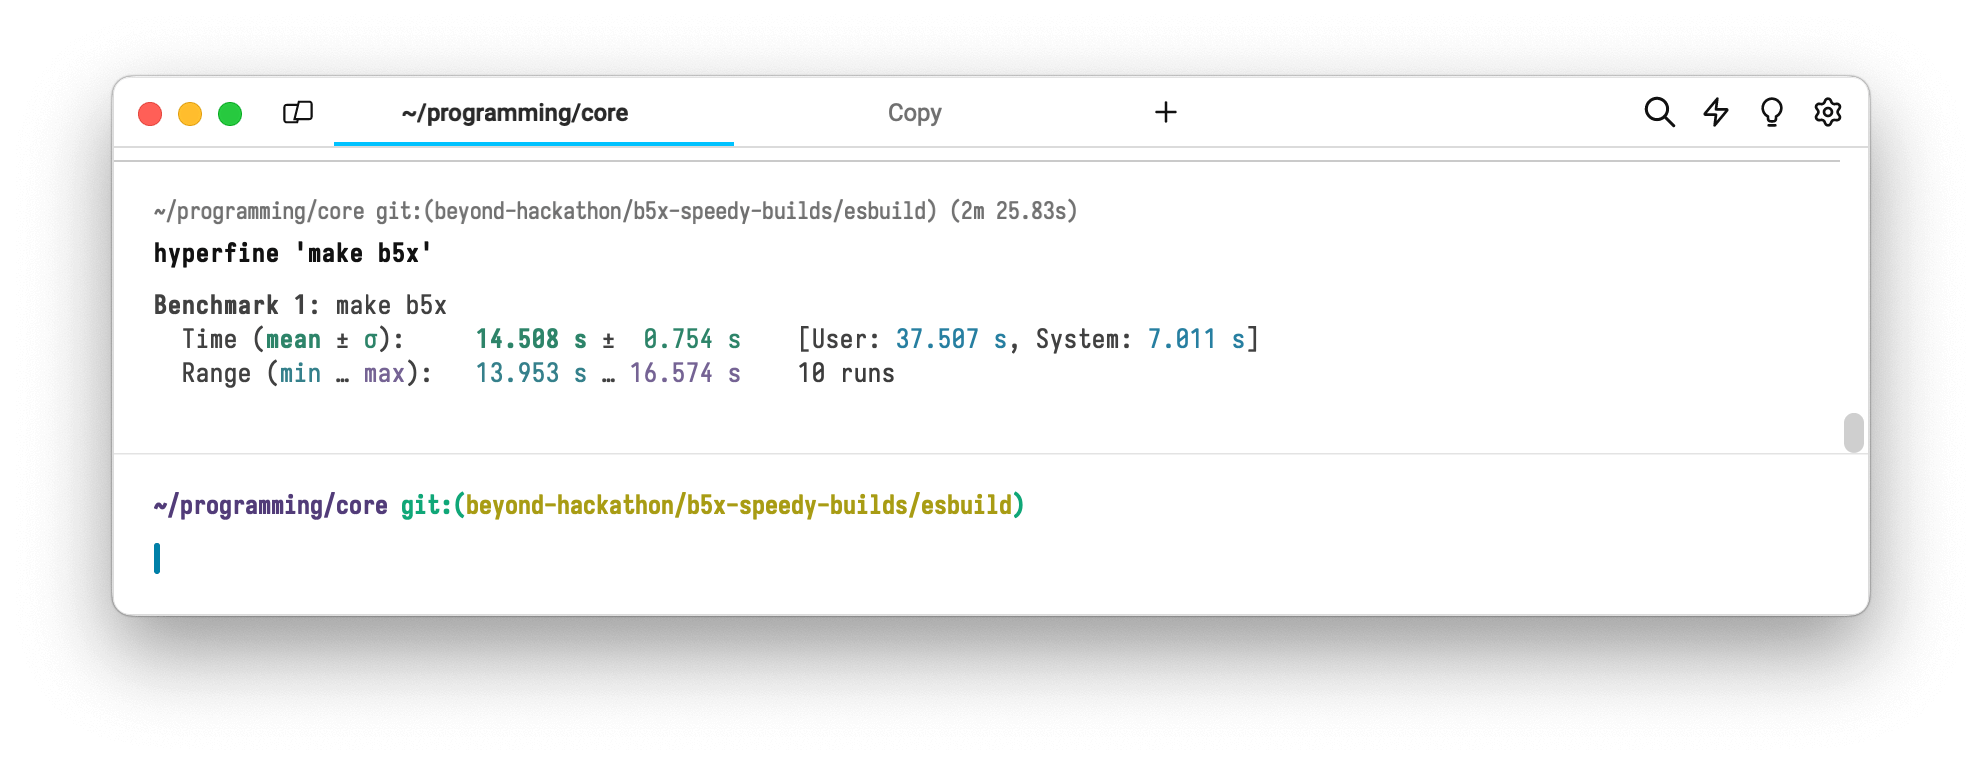
While we hadn’t set out originally with the explicit goal of using esbuild, it had been at the top of our list of things to try. After our first hackathon day we were convinced that it was the best path forward and we spent our remaining two days rebuilding as much of our system as possible on top of it. We learned a lot about esbuild in the process and the outcome was a very successful and award-winning hackathon project that reduced our extension build times by over 70% to around 15 seconds:
And a profile that was looking so much nicer:
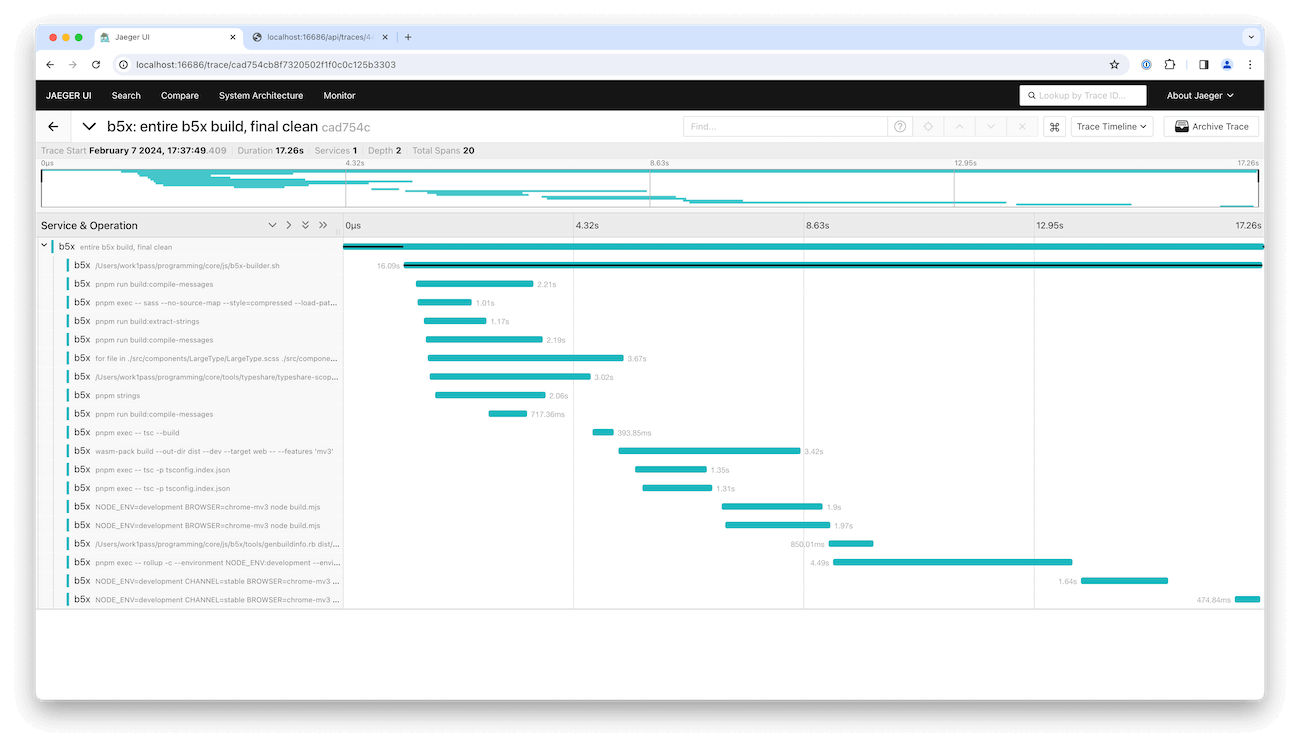
This was a really fantastic outcome! We were thrilled to have been able to deliver this kind of improvement with only a few days of work.
The next step was actually merging the changes.
From hackathon to production
We’ve all been there: you’re in the middle of a hackathon project when somebody encounters a blocker. Multiple suggestions for overcoming the obstacle are put forth, all of which would take too long. Enter: the temporary workaround! A fun, totally crazy hack that befits the hackathon narrative is put in place. Of course, as soon as the hackathon is over and you’re looking at bringing your changes to production, those quick hacks have to be replaced with real solutions.
The new, fast build system we developed during the hackathon had many such hacks:
- We hadn’t actually finished moving the entire system over to esbuild, so there was still Webpack and Rollup usage floating around.
- We hadn’t done any work to consolidate the build process into one location, so it was still spread out across many makefiles, shell scripts, and bundler configurations.
- We broke most of the graphic assets across our web extension and hadn’t fixed them yet.
- Typescript typechecking was removed from the build process and hadn’t been brought back yet.
- Production builds with the new system hadn’t been tested, and we had no idea how they would compare in terms of size or functionality.
- Some necessary changes in internal dependencies from other repositories had yet to be merged, published, and integrated.
- Other aspects of the previous build system, such as Sentry build steps, had yet to be recreated.
- We were missing handling for non-Chrome browsers, polyfills, and store-specific build needs (such as the source code bundle required by the Mozilla store).
After the hackathon ended, I took the above to my manager and the rest of my team and made the case for re-arranging my roadmap so I could bring the new build system to production. I was given the thumbs up and got down to business 🙌.
I began by spending a few weeks diving deep into the remaining problem areas (like how to solve typechecking). The lessons learned from this exploration went into a RFD (Request For Discussion) explaining the why, when, and how for bringing the new build system to production. Once it was approved, I began implementation in earnest.
Let’s dive into two of the most interesting areas of that work: typechecking and bundle size.
esbuild, with typechecking!
It turns out that tsc (the Typescript compiler) is slow and that’s not changing anytime soon.
- stc development is halted.
- Ezno is not aiming for
tscparity. - Typerunner development is halted.
- The Typescript team said in 2020 that they have “no plans” to work on a speed-focused rewrite of
tsc.
The whole point of our new extension build system is speed. tsc is slow. esbuild bypasses tsc completely to achieve its incredible speed but we still need to be checking our types. How do we move forward?
In the Webpack world, fork-ts-checker-webpack-plugin is a popular solution for this problem. It uses a Webpack plugin to run tsc in a separate, non-blocking process, allowing the bundling process to finish first while typechecking is completed in the background. This gives you the best of both worlds: you can keep a fast build process fast while still incorporating full, tsc-based typechecking.
There’s a similar community plugin for esbuild called esbuild-plugin-typecheck. It’s interesting in that it does still run tsc in-process, but it does so in a worker thread, keeping it non-blocking. It also uses tsc as a library (allowing for more implementation flexibility) and runs tsc’s incremental compilation mode on top of an in-memory VFS (Virtual File System) for improved performance on subsequent runs. Very neat!
While esbuild-plugin-typecheck did work fairly well with our codebase, I wanted something that was a bit simpler implementation-wise. I put together a typechecking plugin of our own in ~50 lines of code that spawned a tsc CLI process for each package root that needed to be typechecked. Since we had multiple package roots, this got us some nice parallelism; it also guaranteed that typechecking performed by the build system would always be equivalent to that of a developer invoking tsc directly, which I quite liked.
Once I had that simple typechecking implementation working well on top of the tsc CLI, I added two major enhancements.
esbuild-native diagnostic formatting
The first was improved formatting for tsc compilation diagnostics (warnings and errors). By default, the tsc CLI outputs errors that look like this:

That error format doesn’t quite fit in with other output from esbuild. Let’s see if we can do better.
You can have tsc output a different error format by passing --pretty false:

While this format also isn’t quite what we want, it does happen to be very amenable to being parsed and the tsc-output-parser library does just that! This library takes in the output lines written to stdout by tsc and returns a nice object with all of the parsed error data. We can translate this object into esbuild’s native diagnostic message format like so:
import { $ } from "execa";

async function tscDiagnosticToEsbuild(
	diagnostic: GrammarItem,
): Promise<esbuild.PartialMessage> {
	// sed is currently used to fetch lines from files for simplicity
	const lineText =
		await $`sed -n ${diagnostic.value.cursor.value.line}p ${diagnostic.value.path.value}`;

	// Sometimes `tsc` outputs multi-line error messages. It seems that
	// the first line is always a pretty good overview of the error, and
	// subsequent lines (if present) may present more detailed information.
	//
	// We split the first line overview out to use as the error message,
	// and the rest of the lines to be used as the error notes.
	const [firstLine, rest] = diagnostic.value.message.value.split("\n", 2);

	return {
		location: {
			column: diagnostic.value.cursor.value.col - 1,
			line: diagnostic.value.cursor.value.line,
			file: diagnostic.value.path.value,
			lineText: lineText.stdout,
		},
		notes: rest && rest.trim().length > 0 ? [{ text: rest }] : [],
		text: `${firstLine} [${diagnostic.value.tsError.value.errorString}]`,
	};
}
These esbuild-native objects can be written to our own stdout using esbuild’s helper functions, and they look great:

A more complex error is even better at showing off the benefit of using esbuild’s formatting. Here’s one:


The tsc error formatting starts off with multiple lines of error description, which is a bit overwhelming. It also has the error file location separated from the error source code excerpt. The esbuild-formatted error, on the other hand, splits the extra line of error description off into a note at the bottom, and includes all the source code information prominently in the center.
All together, translating tsc diagnostics into the esbuild format allowed us to unify diagnostic formatting across the entire build system. It also made tsc diagnostics easier to read.
Automatically verifying that all build inputs are being typechecked
I’ve had some great conversations about web project build systems with my colleagues over the years. We’ve discussed modern tools such as esbuild, which promise better performance, many times.
One question always surfaced: if tsc is no longer handling your Typescript compilation, how do you guarantee that all of your build inputs are actually being typechecked? It’s easy enough to run tsc --noEmit in your project root but that doesn’t by itself provide any guarantees that are tied to your build system.
For example, if you have multiple projects that each need to be typechecked, it’s possible that you could forget to include one in your typecheck plugin config. Boom – now you’re shipping production code that isn’t being typechecked. Bummer! It’s always going to require reliance on some measure of luck and human observance to prevent this from happening, and that’s never made us feel all warm and fuzzy inside.
What if we could rebuild that connection between the build system and the typechecker, though? We want to get back to knowing that if our build finishes successfully, we’re guaranteed to have typechecked all of the inputs.
I noticed that tsc offers a --listFilesOnly flag. It causes tsc to print a newline-separated list of filepaths involved in compilation. On the other side of the fence, I also knew that esbuild generates a Metafile that describes all build inputs:
interface Metafile {
	inputs: {
		[path: string]: {
			// ...
		};
	};
	// ...
}
I realized that given this information, we could:
- Build a set T containing all of the input filepaths from the
tscinvocations that the typechecking plugin was configured to run. - Build another set E containing all of the Typescript input filepaths from the esbuild Metafile.
- Compute the difference between the two sets (E - T).
- If the resulting set is empty, all build inputs were typechecked.
And it worked out very well! Here’s a screenshot showing the information output:
![A screenshot of a terminal showing some log messages and the words '✅ All first-party input files used in the bundling process were typechecked [552 first-party inputs, 4839 files checked by tsc]' A screenshot of a terminal showing some log messages and the words '✅ All first-party input files used in the bundling process were typechecked [552 first-party inputs, 4839 files checked by tsc]'](/posts/2024/new-extension-build-system/typechecking_integrity_verification.png)
I got validation that this approach was helpful very quickly. A couple days later I made a change while iterating on the build system that resulted in a new package not being typechecked. Instead of finding out weeks later, I immediately became aware of the configuration error through CI a few minutes after pushing the commit. I was then able to fix it up and continue on without a second thought.
And while we’re on the topic of benefiting from smart build tools…
Production bundle size improvements (esbuild rocks)
Towards the final stages of implementing the new build system I turned my eye toward production builds. Our team knew they worked but there were still some details to be investigated (like comparing production bundle sizes).
esbuild has a fantastic bundle size analyzer. It accepts the Metafile mentioned earlier as input and then renders a variety of delightful visualizations that not only help you understand what the size of your bundle is, but also why it’s that size. Click on the “load an example” button in the analyzer and take it for a spin. It’s fun!
While I was poking around our production bundle analysis, I noticed something odd:
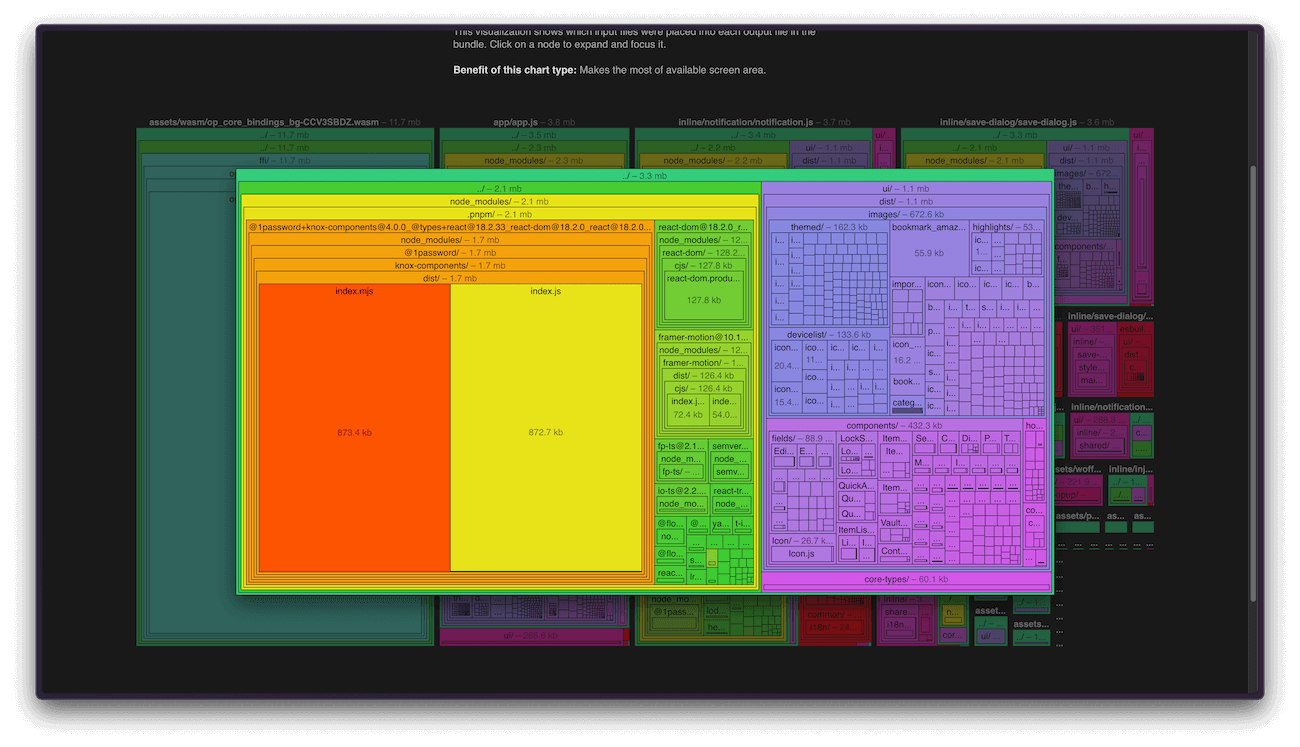
Here we’re seeing the treemap visualization for one of our entrypoints. The largest block contributing to the size of this entrypoint happens to be @1password/knox-components (our internal UI component library). But … looking closely, there appear to be two blocks of equal size inside of it: index.mjs and index.js. Surely we don’t need both the ESM and CJS builds of the library to be in our production bundle?
This is where esbuild’s analyzer takes it to the next level. If we click on the @1password/knox-components/index.js block:
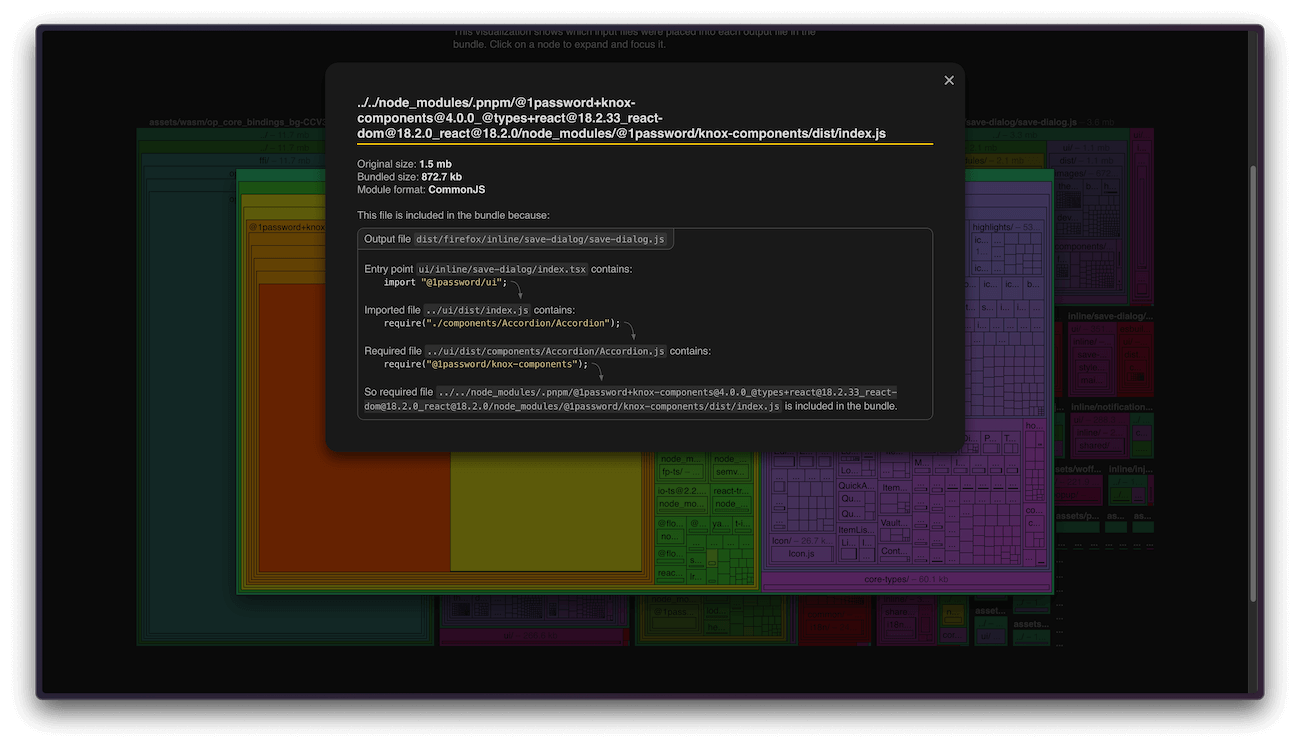
It tells us exactly what’s causing the CJS build of @1password/knox-components to be included in our production bundle! Some code we were importing from another internal library was itself importing @1password/knox-components via a require statement, and require forces CJS to be pulled in over ESM. The author of esbuild has written some great comments explaining this situation in more detail.
Armed with this information, I was able to quickly track down and fix the package misconfiguration in our internal library, resulting in an exciting file size win for this entrypoint (3.3 mb -> 2.1 mb):
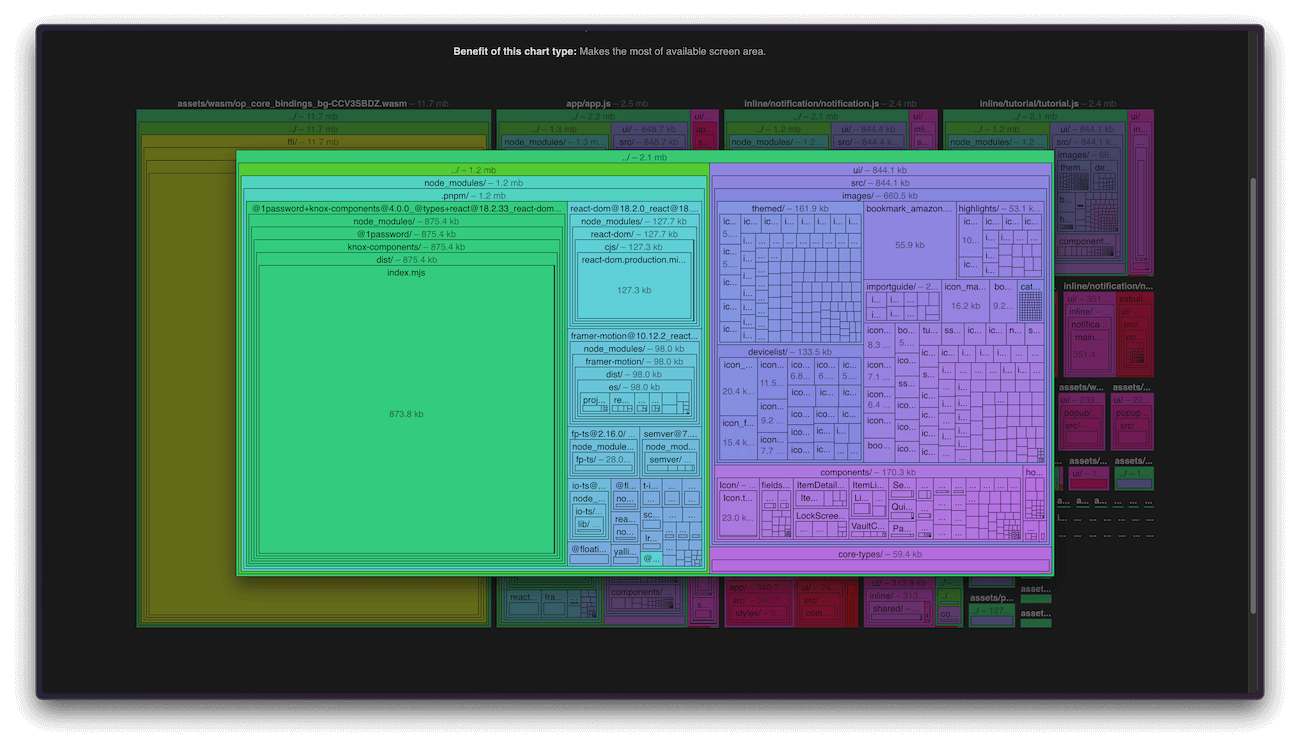
And given that we use our UI component library across many entrypoints, the file size win applied in multiple places. This resulted in the new build system producing a smaller production extension build in significantly less time. Awesome!
Let’s talk impact
I was thrilled to see the (large) changeset for the new build system merge into main only a few months after the hackathon project that started it all. (I was also a little bit sad because I had so much fun working on it!) The only thing left was to better understand the impact it had on our product.
Earlier I mentioned that the new build system had reduced warm extension build times by over 70%, bringing them from one minute, ten seconds to fifteen seconds. I’m happy to say that the production implementation resulted in a reduction of more than 90%, and a warm build time of just five seconds. It also included a watch mode that can rebundle the extension’s Typescript files (which make up a majority of the codebase) in under a second every time changes are written to disk.
Numbers are only one way to measure impact, though. A number of my colleagues have shared amazing stories about how the new build system has made their lives so much easier and let them iterate on important changes more quickly than they ever thought possible. Their experiences paint the numbers with color and meaning in a way that’s truly inspiring!
It’s also useful to consider the impact that the new build system didn’t have. For example, if you use 1Password in the browser, you’ve got a little icon in your browser toolbar right now that’s powered by output from this new build system, and you’d most likely never have known anything had changed behind the scenes if it weren’t for this post! Our QA team and many developer volunteers worked tirelessly to comb over builds from the new system and confirm their integrity, and their wonderful work meant that we were able to keep shipping to millions of people without interruption. Yay!
Developer satisfaction with the extension build system has also improved dramatically. I ran two polls internally: one before work began and one just recently after it had been merged for some time. The “before” poll saw 97% (n=31) of extension developers saying they were unhappy with extension build times. The “after” poll flipped that number right around to 95% (n=22) happiness. Happy developers build great things, so it’s wonderful to have been able to move this metric so far in the right direction in a short amount of time.
In conclusion
The extension builds faster, esbuild is awesome, and hackathon projects are the best 😎.
If making developers happy and productive with fast build systems sounds fun to you, consider joining our team!

 by Jarek Samic on


